The Result
Helped secure $2M seed round. Dashboard became a core product feature.
The Challenge
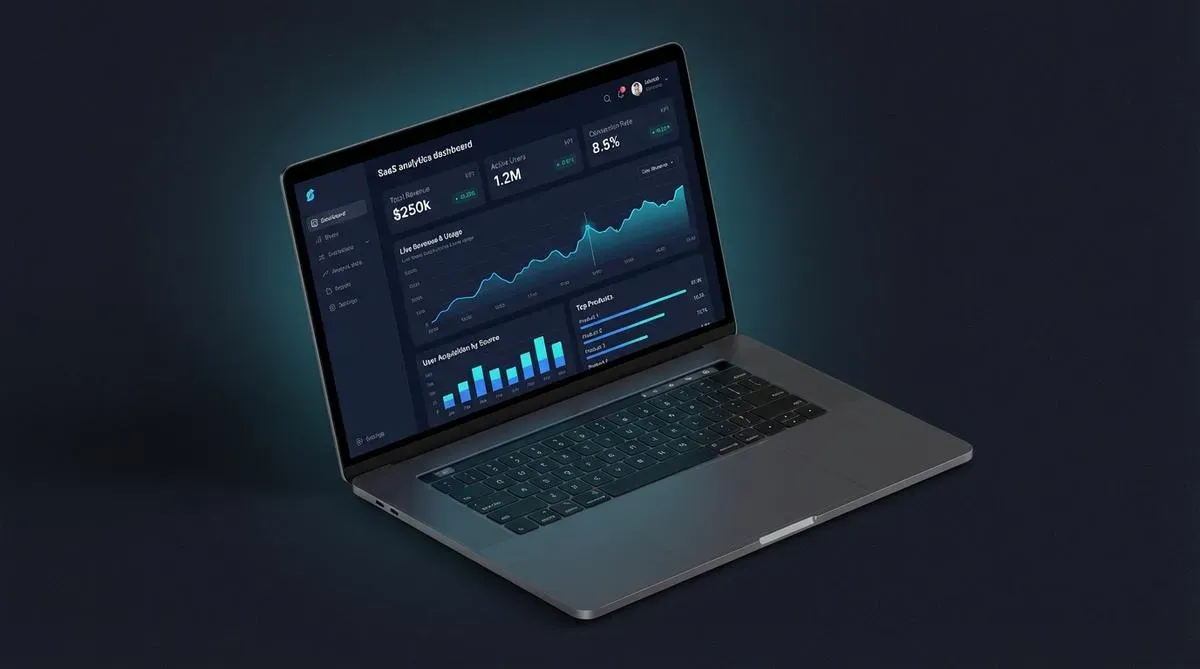
An early-stage SaaS startup was preparing for their Series Seed round. Investors wanted to see real-time product metrics — user growth, engagement, retention, and revenue. The startup had the data in their database but no way to visualize it. They needed a dashboard that would impress investors and eventually become a customer-facing feature.
Our Approach
How We Built It
Designed the dashboard information architecture with the founders and lead investor
Built custom D3.js visualizations for key metrics: MRR, churn, cohort retention, and NPS
Implemented real-time data updates using Supabase Realtime subscriptions
Added role-based access: admin view with all metrics, investor view with curated KPIs
Created PDF and CSV export functionality for board meeting reports
Optimized query performance for sub-second dashboard loads even with 6 months of data
Tech Stack
Every technology choice was driven by the project's specific requirements and constraints.
Ready to Start Your Project?
Get a free estimate or book a 30-minute strategy call.